When did it happen?
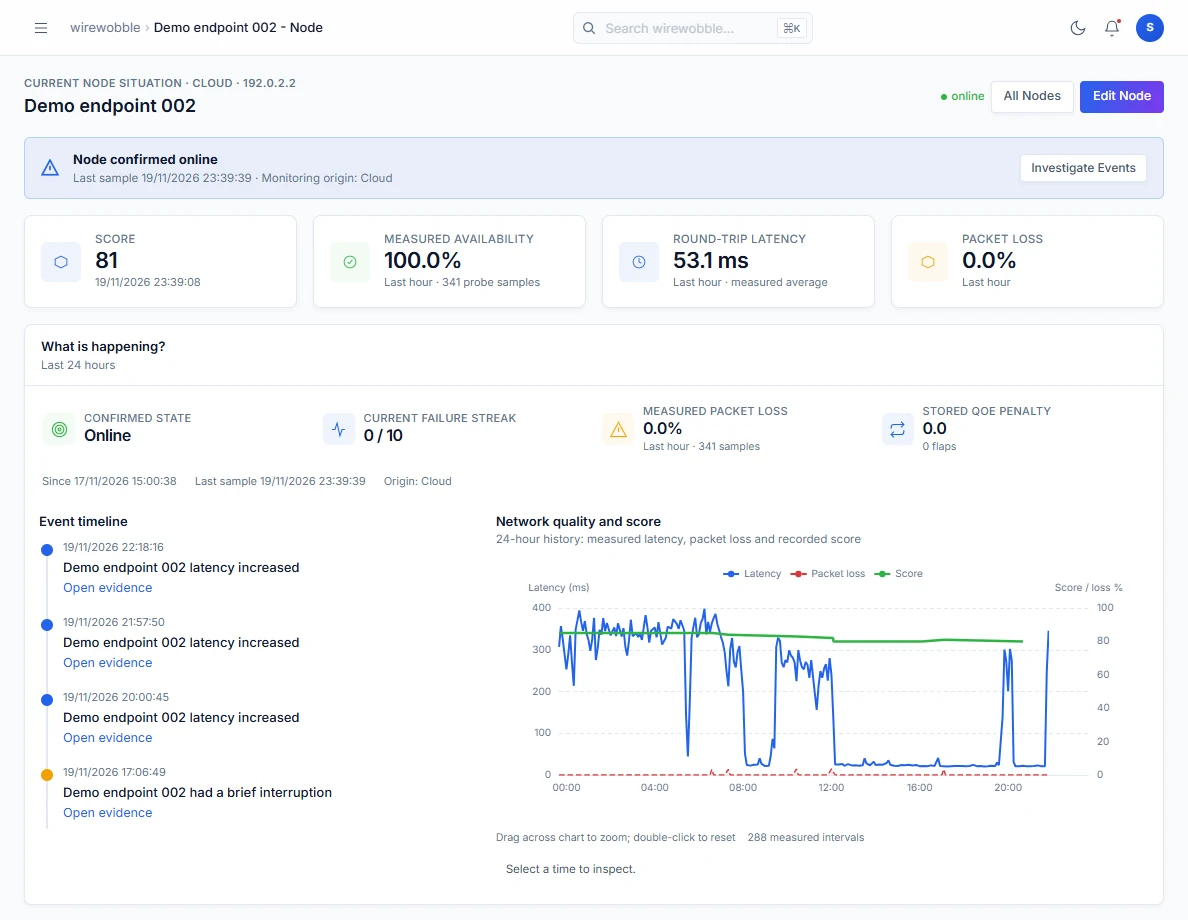
Use the node history and Events to find the period when connectivity failed or performance changed.
 MAKE IT POSSIBLE. MAKE IT DEPENDABLE. MAKE IT BETTER.
A RISMOR PRODUCT / WIREWOBBLE
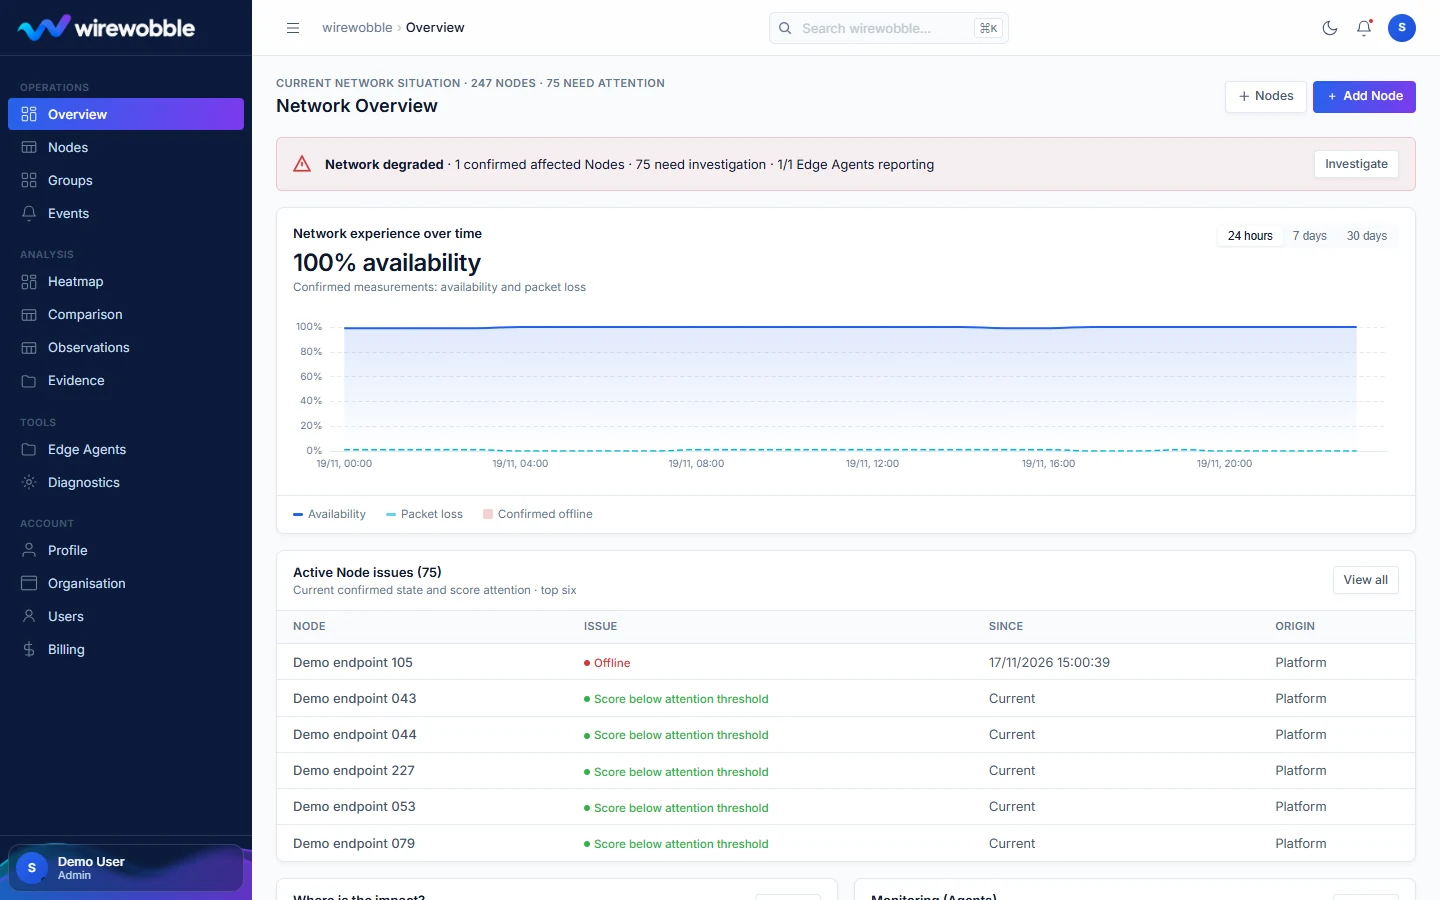
The network is up. Your users say it's slow. The provider sees nothing wrong. Then everything recovers before you can investigate.
wirewobble keeps watching and recording network behaviour, giving you the history to see what changed, when it changed and where it was measured.
Network monitoring. Intermittent fault investigation. Evidence you can use.
THE PROBLEM WE KNOW
It's fine now. But it wasn't.
You've heard it before. “The Wi-Fi keeps dropping.” “Every afternoon the system crawls.” “Our calls keep breaking up.” By the time somebody gets a chance to look, the connection appears healthy and the trail has gone cold.
The difficult question isn't always whether something is online. It's whether the connection was stable, where the instability was observed, which other services were affected and whether the same pattern keeps coming back.
That's why we built wirewobble. Not another collection of status lights. A way to follow what the network actually did.
LOOK PAST UP AND DOWN
A connection can answer a check while still losing packets, slowing down or changing route. wirewobble brings availability, latency, packet loss, observed changes and history into the same investigation.
You can follow the symptoms before, during and after an incident, rather than relying on the moment somebody happened to check.
A PRACTICAL INVESTIGATION
Start with the complaint, then work through a record of the network's behaviour. The measurements are there to answer questions, not just fill a dashboard.
Use the node history and Events to find the period when connectivity failed or performance changed.
Use Heatmap and side-by-side Comparison to distinguish one problem target from a wider pattern across nodes or sites.
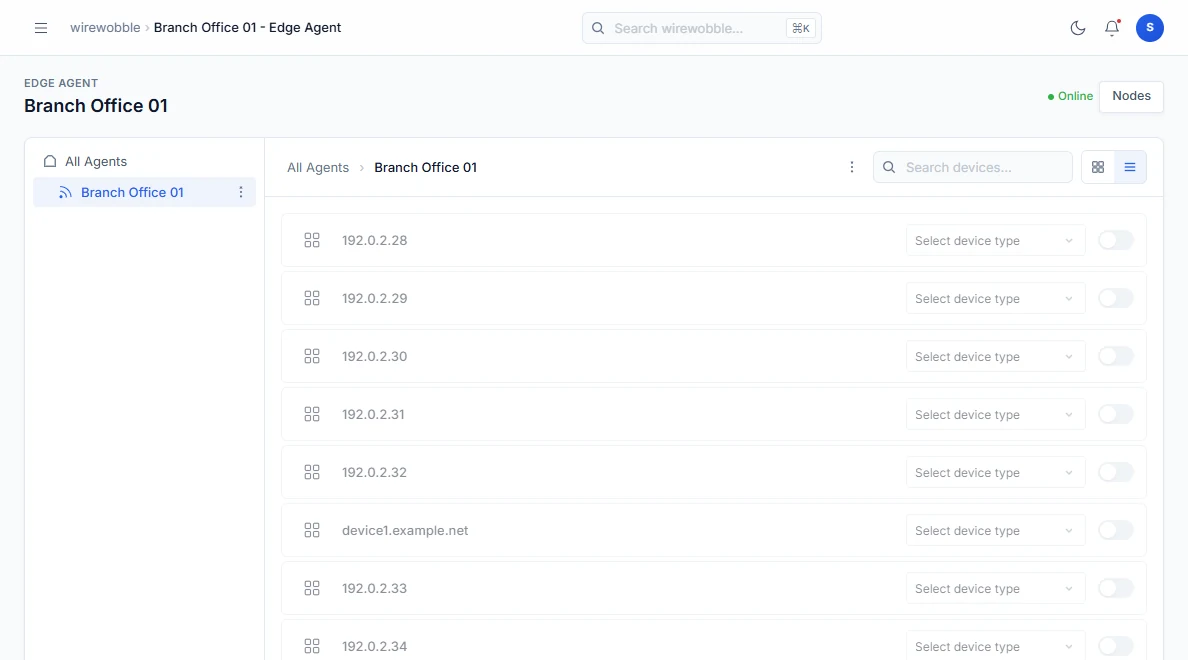
Compare observations from the public platform with measurements from wirewobble edge inside a site.
Take the timeline, measurements, events and relevant path observations into the conversation with your team or provider.
SEE THE HISTORY, NOT JUST THE STATUS
Availability, latency, packet loss and the event timeline sit together on a single node investigation. You can see how the connection behaved while users were experiencing the problem.
02 / NODE INVESTIGATION
WHERE IT EARNS ITS KEEP
Catch short losses and instability in the recorded timeline, even when everything looks normal again by the time you investigate.
Use time-aligned observations to compare the site, the wider network and externally monitored services when fault ownership is unclear.
Look for coinciding latency increases, packet loss and path changes when users describe a connection that technically stays online.
See whether a disruption is isolated to one site or appears across several monitored locations in the same period.
THE MOMENT THINGS CONNECT
Put monitored nodes side by side, align their measurements and see whether a disruption happened to one target or several at once.
The comparison view keeps the timing, impacted nodes and related events in view, making the next investigation far more focused.
03 / TIME-ALIGNED COMPARISON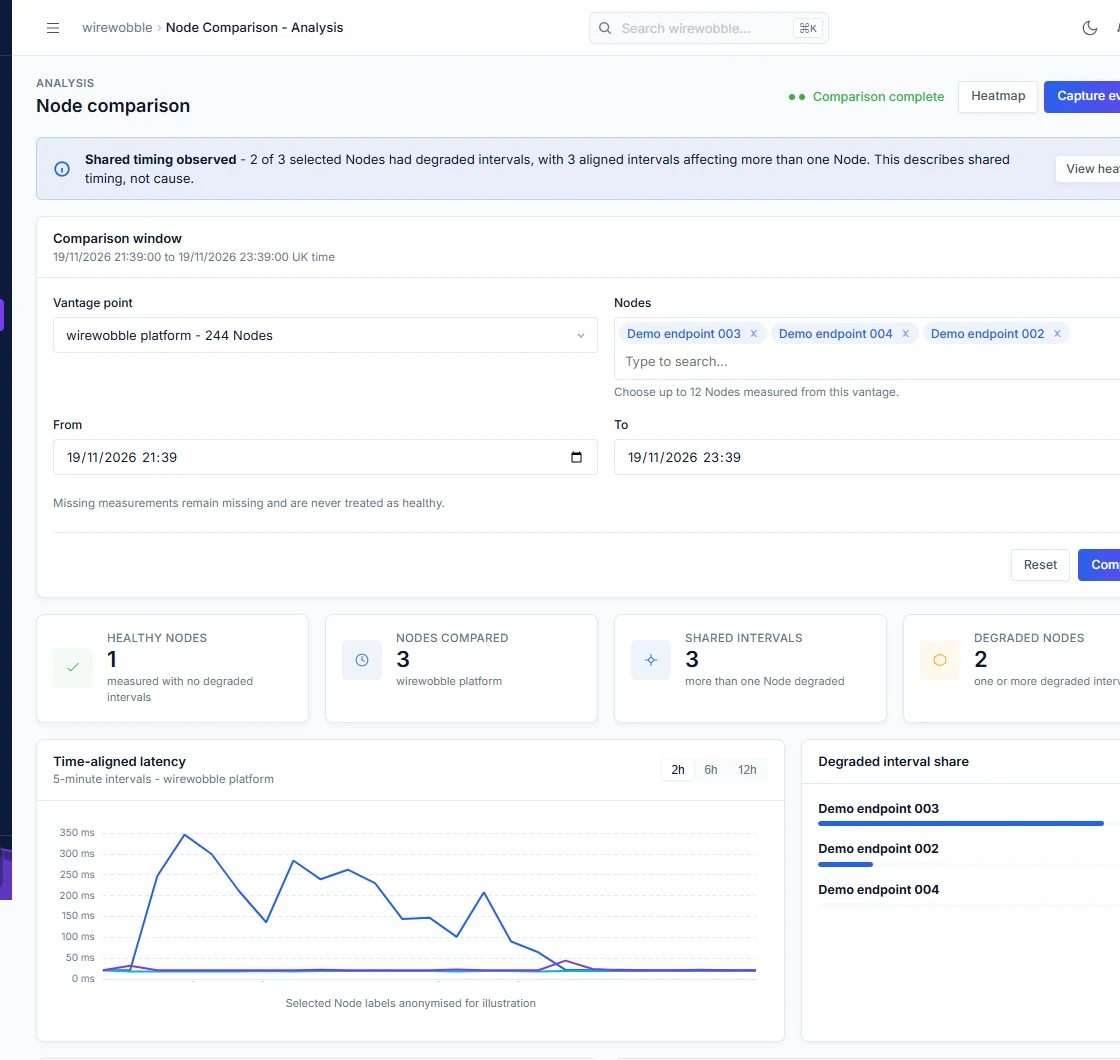
WHERE YOU LOOK FROM MATTERS
A service can look healthy from the internet while users inside the building experience something completely different.
Monitor internet-facing services and endpoints directly from the platform.
Deploy wirewobble edge at a site to monitor local devices and services from inside the network.
Every reading keeps its measurement origin, so you can compare what the platform sees with what's happening inside each site.
USEFUL TOOLS, CONNECTED
Every view answers a different question, using the measurements gathered by the platform and your edge agents.
01 / MONITOR
Track selected devices and services, their state, recent transitions and when they were last checked.
02 / UNDERSTAND
Spot degraded connection quality even when a device remains reachable.
03 / CORRELATE
Revisit state changes and incidents, compare the sequence of events and attach investigation context.
04 / DISCOVER PATTERNS
Find aligned disruptions, recurring time-of-day problems and differences between monitored targets.
05 / SEE THE PATH
Review recorded route and traceroute information alongside reachability changes when investigating a connection.
06 / WORK TOGETHER
Keep relevant people informed and use recorded measurements to support investigation and escalation.
WHAT CHANGED, AND WHEN?
Monitor event volume, investigate the periods that need attention, and follow changes instead of starting from scratch when somebody reports a problem.
05 / EVENTS & HISTORY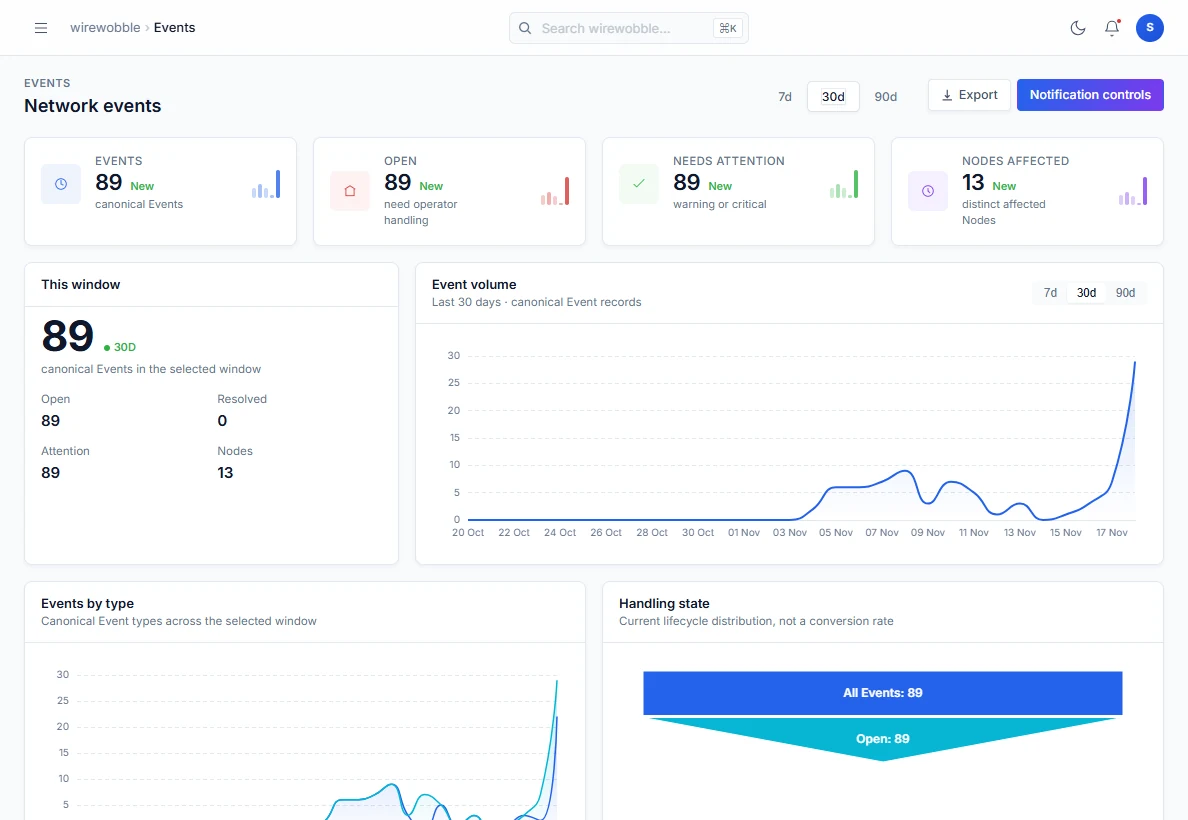
START WITH WHAT MATTERS
Choose the public services or devices that matter, add wirewobble edge wherever a local perspective is important, and start building a history to investigate when the next wobble appears.
FROM RISMOR TO WIREWOBBLE
wirewobble is a Rismor product with its own website, application and self-service sign-up.
GOOD QUESTIONS
Yes. Deploy wirewobble edge to monitor devices and services inside your network. You can also monitor public endpoints directly from the platform.
wirewobble keeps probe results, packet loss and latency history, so you can investigate brief interruptions after the connection recovers.
Use measurements, time windows, comparisons and relevant Events to give the provider a clearer account of where and when a problem was observed.
A LITTLE LESS GUESSWORK
Better troubleshooting starts when you can move beyond opinions and follow the measurements. That's the reason wirewobble exists.
Keep the history. Find the pattern. Make the next decision with evidence.